by Alex Addyman
The World Health Organization (WHO) has today released air quality data for 1600 world cities across 91 countries. In the press release accompanying the data release WHO explained that:
- Only 12% of the people in cities covered live within WHO’s recommended air quality guideline levels.
- About half of the urban population being monitored is exposed to air pollution that is at least 2.5 times higher than the levels WHO recommends – putting those people at additional risk of serious, long-term health problems.
- In most cities where there is enough data to compare the situation today with previous years, air pollution is getting worse.
What can be done?
WHO suggests that to improve air quality policy measures must be taken. These include banning the use of coal for space heating in buildings, using renewable or ‘clean’ sources for electricity production and improving the efficiency of motor vehicle engines.
The UK picture
Air quality in this instance is represented by annual mean concentrations of fine particulate matter (PM10 and PM2.5, i.e. particles smaller than 10 or 2.5 microns). Air quality measurements describe PM concentrations through micrograms per cubic meter (ug/m3). Particulates of 10 microns or fewer are the most dangerous as they can penetrate and lodge within lungs heightening the risk of developing cardiovascular and respiratory diseases and lung cancer.
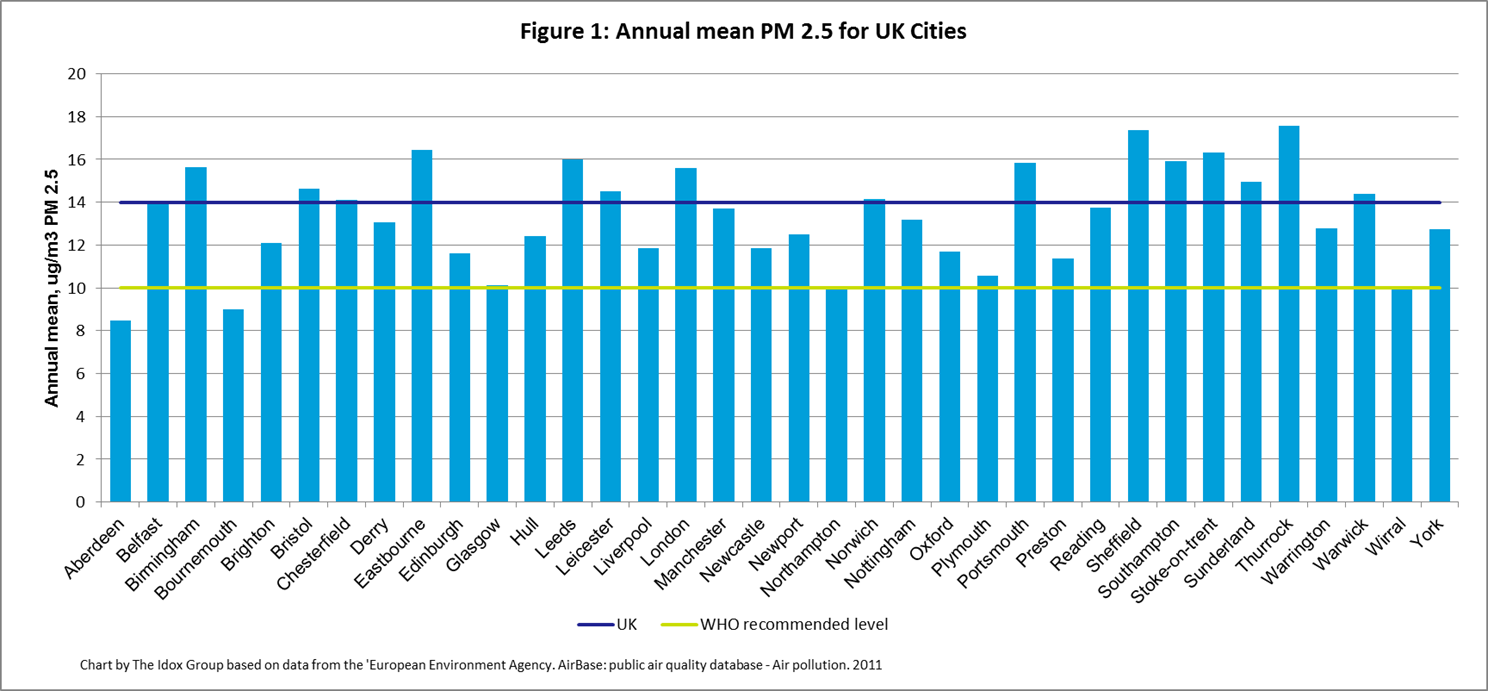
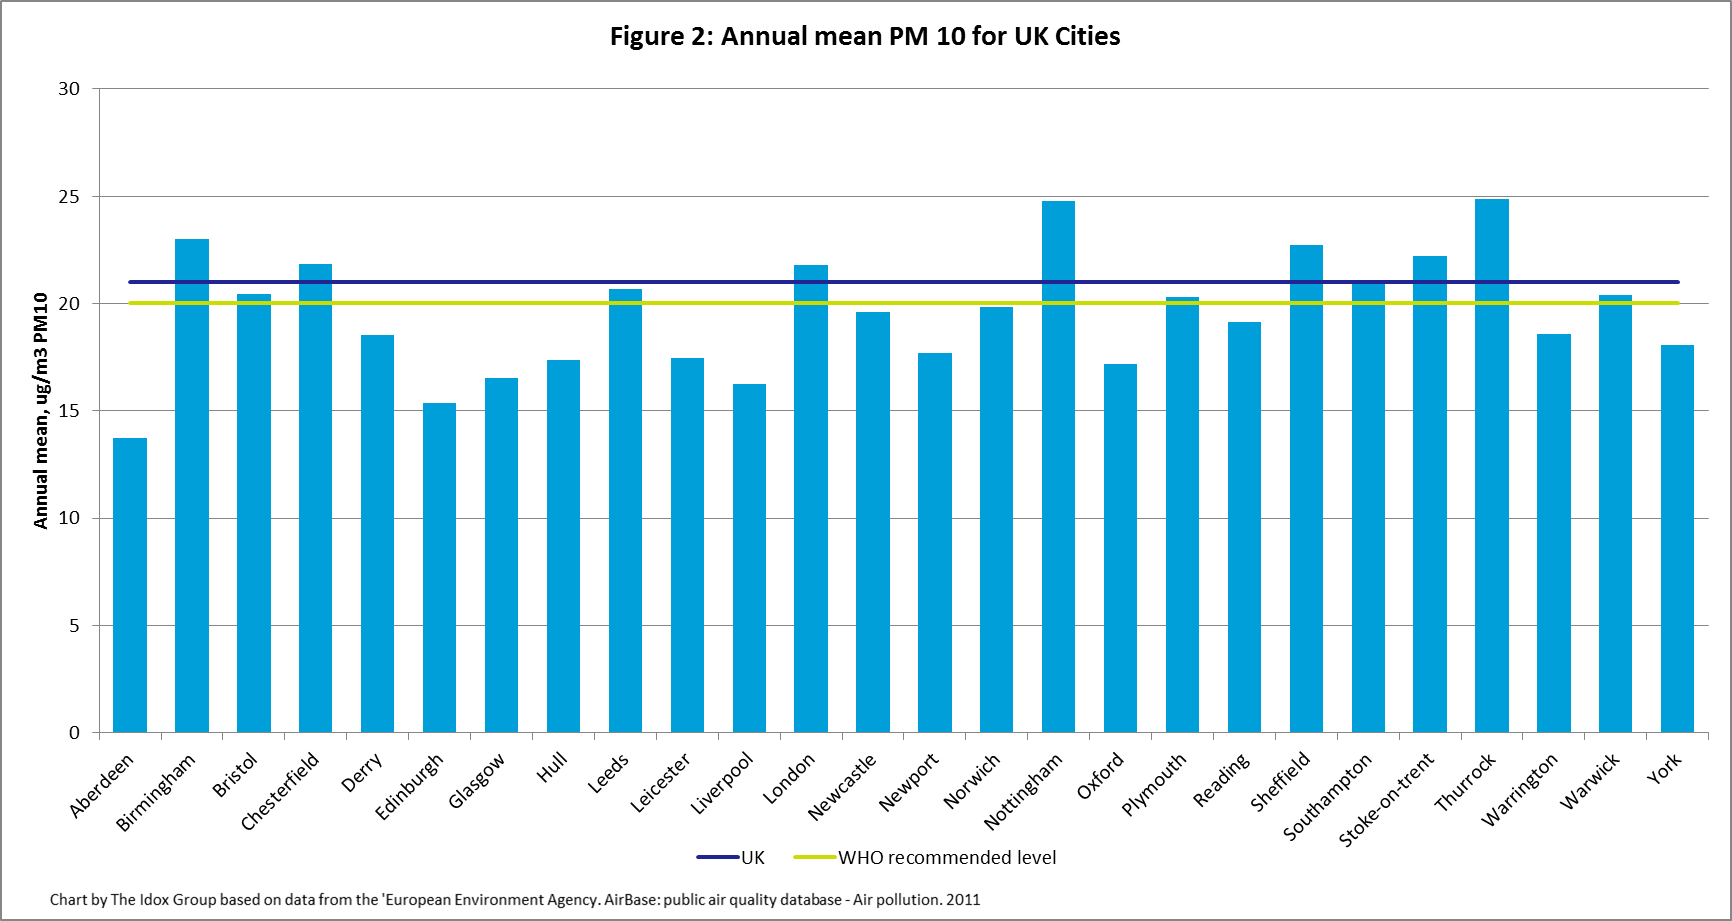
Measurements are attained using monitoring stations in cities and background stations. Every UK place in the database had a PM 2.5 value which are shown in Figure 1. Those UK places which had PM 10 values are shown in Figure 2.
PM 2.5
Almost all UK places in the database have PM 2.5 levels above the recommended WHO level of 10 ug/m3 – the UK average is 14 ug/m3. Five places meet the WHO recommended levels: Aberdeen, Bournemouth, Glasgow, Northampton and the Wirral. Other places between the WHO recommended levels and the UK average include Brighton, Edinburgh, Hull, Liverpool, Manchester, Newcastle-upon-Tyne and York.
The place with the highest levels of PM 2.5 in the UK is the coastal town of Eastbourne in East Sussex. Other places with higher than the UK average levels include Birmingham, Leeds, London, Portsmouth, Sheffield and Stoke-on-Trent. It should be noted that London’s levels are an average based on three monitoring stations.
 PM 10
PM 10
The UK average for PM 10 stands at 21 ug/m3 which is close to the WHO recommended level of 20 ug/m3. Areas beneath the UK average and WHO recommended levels include Aberdeen, Edinburgh, Glasgow, Liverpool, Leicester and Oxford. Those above include Birmingham, Chesterfield, Leeds, London and Sheffield. Thurrock and Nottingham have the highest levels of PM 10 in the UK at 25 ug/m3.
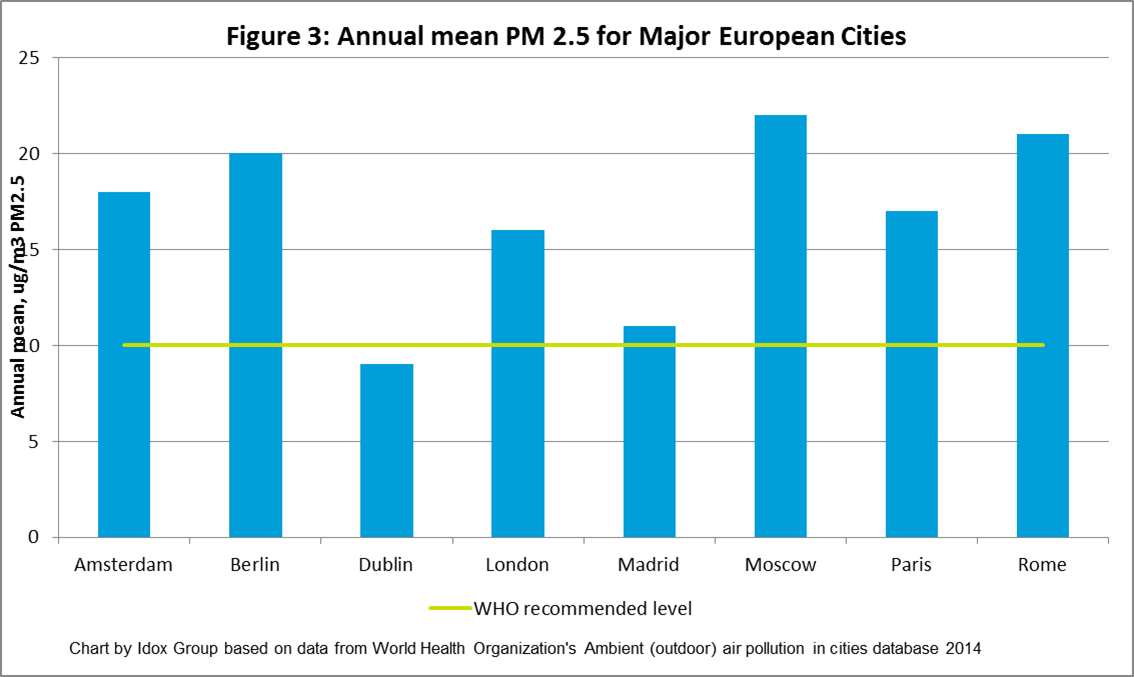
Compared to other Western countries with similar socio-economic status (defined as high income countries by WHO) UK cities perform well on the whole as shown in Figure 3. London has lower PM 2.5 levels than Paris, Rome, and Berlin. Madrid and Dublin by comparison have lower levels (although they are much smaller cities).
Share
Related Posts
Supporting residents on the decarbonisation journey: leveraging data for effective retrofit projects
As the drive towards decarbonisation intensifies, the social housing sector’s ability to collect, store and manage vast amounts of data becomes increasingly critical. With a shared goal of creating warmer, carbon-free homes, housing associations’ strategic use of data is essential ....
The recent spikes in energy costs have thrown into sharp focus the challenge of heating our homes. Domestic heating is important, not just for our comfort and wellbeing, but to reduce humidity and prevent condensation. But because traditional heating systems ....
By Donna Gardiner While free school meals (FSM) have been available in England on a means-tested basis since 1944, recent years have seen a renewed focus upon the potential benefits of providing free school meals to all school-aged children. Currently, ....
By Ian Babelon A new-old concept for proximity “Are we there yet?” Parents may patiently nod to their children’s insistent nudges on a 20-minute journey to… somewhere. Quite rightly, researchers have asked: twenty minutes to what? The answer may well ....


